In Juneau, a new website offers anxious residents a better way to prepare for floods
The interactive Juneau Flood Dashboard shares maps, alerts, and water level forecasts for valley homes under different flood scenarios.

Wedding photographs, an heirloom hope chest, two refrigerators, a freezer — and the silty floodwaters disappeared them all from Debbie Penrose-Fischer’s detached garage, mementos and meals gone to the force of Mendenhall gray.
She maneuvered her mobility scooter to her living room window, listening as the sloshing waters made a strange music in the streets-turned-streams. Later she would watch a video of a neighbor’s piano floating in the current down Emily Way.
In the attached first-floor apartment, her 95 year-old mother kept a close eye on the house across the street. Penrose-Fischer’s daughter and two grandchildren had moved in not six months earlier, bringing four generations together in the Mendenhall Valley. The arrangement had seemed to promise stability. But other neighbors were moving away, citing the cost and physicality of the annual glacial lake outburst flood.
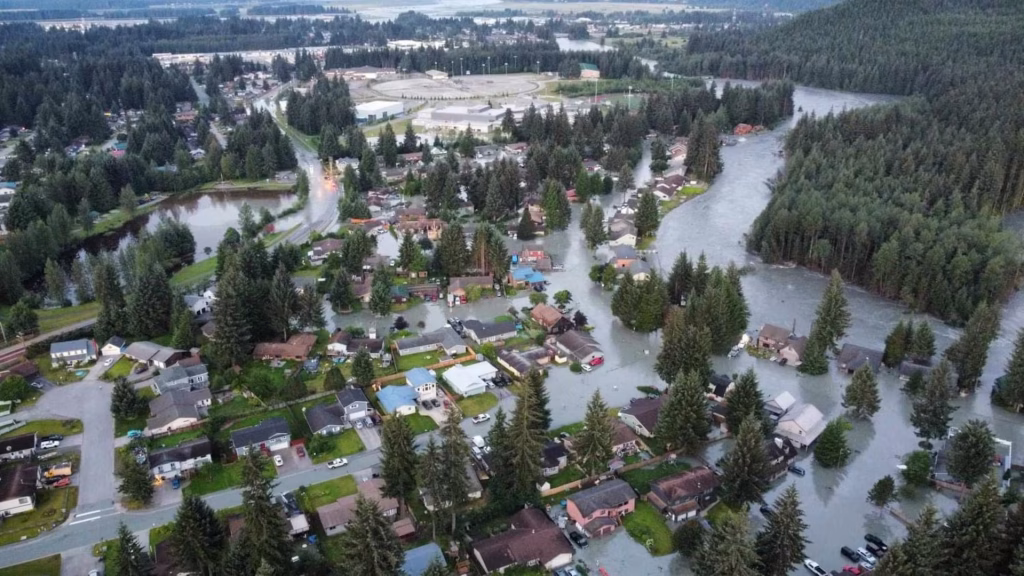
Each year it is expected, and yet the shock is fresh when waters cascade from Mendenhall Lake toward homes. Residents were taken by surprise again when the Mendenhall River overtopped last August and rushed to rust cars and rinse living rooms. The fourteenth flood in as many years, 2024 was one of the most devastating. Millions of dollars of property were sunk in mere hours. Hundreds of vulnerable vehicles sat water-logged. Insurance premiums skyrocketed.
“This is a serious, serious issue on a number of levels,” reflects Penrose-Fischer, who has lived in Juneau for 33 years. “Financially, the impact is huge. People can’t handle the stress. They have nightmares about walking outside and seeing walls of water coming toward them.”
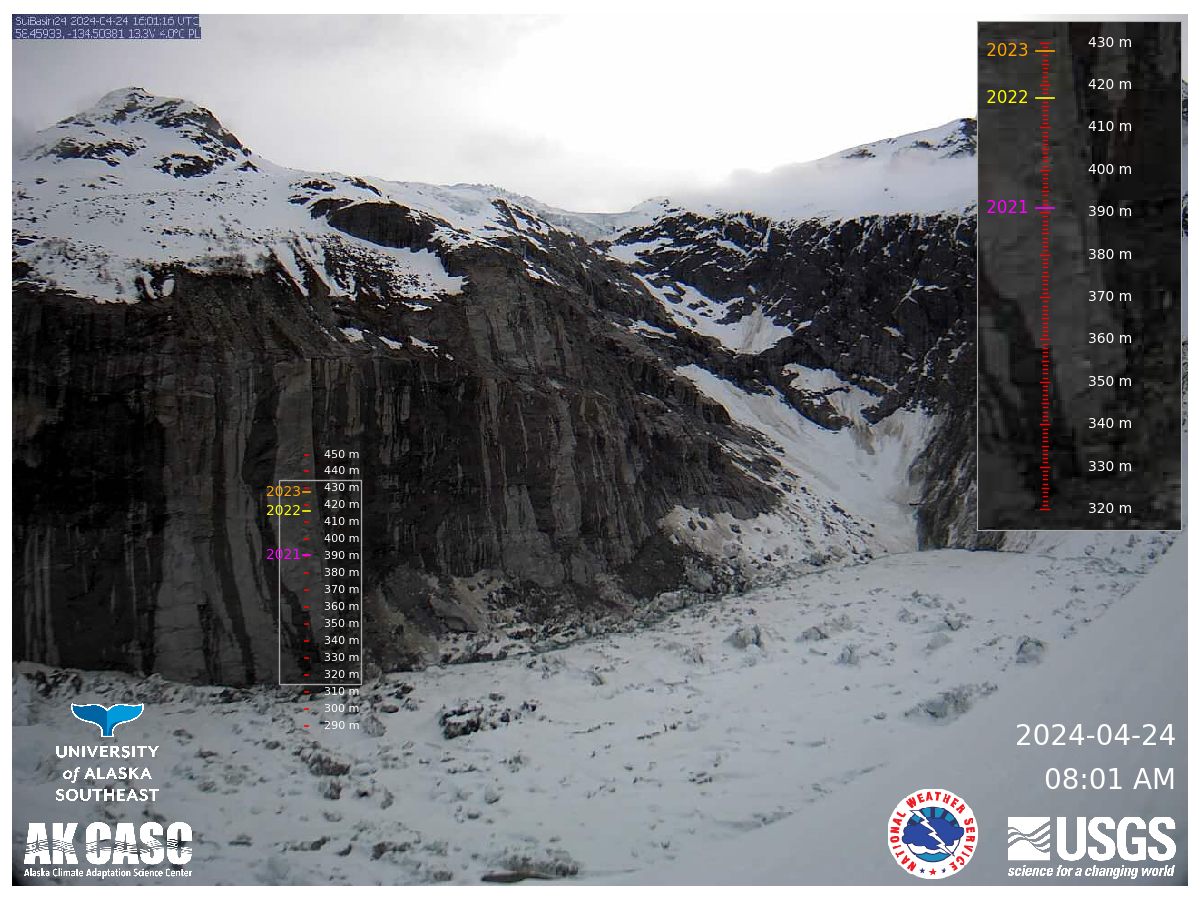
To the credit of the city and federal agencies, forewarnings of the flood exist — the time-lapse cameras and the graphs made from gauge readings. Historical data referencing crests, peaks, and releases. Resources available for download, analysis, interpretation. But the language of science, hardly universal, is often incompatible with the alphabet of anxiety. Unlike most floods, it isn’t spurred by rains. Its geology is confusing even to those who study it. Many unknowns persist.
“The National Weather Service has a great monitoring page, but it’s really geared towards operations, and not necessarily historical information or what something means,” says Aaron Jacobs, a senior service hydrologist with the agency, based in Juneau.
The page receives close to one million visitors each year — a staggering amount, when compared to the capital’s population of 32,000 — though its information isn’t tailored for public consumption. “Even after all these floods,” Jacobs says, “people have a difficult time understanding and visualizing inundation maps.”
The inertia of wishful thinking has also been a barrier to preparation — residents hoping they won’t be affected, or remembering years past where the flood was less impactful. But after last August’s damage, the reality of its future in Juneau has firmly sunk in. Its variability is appreciated. And for the next several decades, it is certain to recur. “We need to be able to communicate the forecasts, the different scenarios that could take place, and the unknowns,” Jacobs says.
Penrose-Fischer likens the flood to a diagnosis the city has been dealt. Now it’s about managing the pain, she says. People need simple numbers to grasp. Translations of complicated nuance. What does the water level in Suicide Basin mean for the front room carpet? How does the ice dam influence what roads one can take to pick up prescriptions?
They are the science communication challenges that doctors have down, Penrose-Fischer says. When they say pulmonary hypertension, she knows the figure she needs to concern herself with is blood pressure. Several hours into last year’s flood, when her home lost electricity, her rechargeable oxygen tank fell to within eight minutes of emptying. As waters continued to surround Penrose-Fischer’s home and her supply dwindled, a rescue team evacuated her in a raft in the early hours of the morning.
A Tool for Adaptation
“Last year, the extent of flooding caught people by surprise,” says Eran Hood, a hydrologist and professor at the University of Alaska Southeast (UAS). A Juneau resident, he’s been studying the floods and the region’s hydrology for more than two decades. “This year, we hope to have tools in place that will provide people with more information about the threats posed by the outburst flood.”
What is known of Suicide Basin comes from a patchwork of people and organizations — each playing different roles. The U.S. Geological Survey maintains the gauges which measure water levels in the lake and at the glacier. The National Weather Service (NWS) receives this data and creates flood forecasts. When these forecasts spell danger, the City and Borough of Juneau (CBJ) help push alerts.
But each agency is siloed within their particular mission, and there has never been a central hub where all of this information could coexist — until now. Researchers at UAS have worked with these agencies to provide Mendenhall Valley residents with a way to better understand the implications of flood forecasts for their properties.
“The Juneau Flood Dashboard provides a new way to visualize flood inundation maps,” Hood says. “Making the maps easily accessible and viewable will increase residents’ ability to make informed decisions and protect their property.”

Launched this May, the resource is the work of Sean Fagan, a fellow with the Alaska Climate Adaptation Science Center and a graduate student in Lund University’s Centre for Sustainability Studies.
Over the span of just a few months, Fagan and Hood worked with agency partners and the CBJ to create an interactive map of the Mendenhall Valley that shows the streets which are likely to be flooded when the lake reaches different water levels. Hovering one’s cursor over the flood map reveals the expected depth of the floodwaters.
Color-coded flood stages list the major roads that may close due to water. And residents can search their own address and toggle through different scenarios — including how flooding might change once the city’s new HESCO barriers are operational — to learn more about the conditions that would place their home at risk. Real-time lake level readings, with NWS alerts, are refreshed every 15 minutes.
Because of the dashboard’s visual nature, Fagan says he hopes that some of the hard-to-grasp hydrological concepts, which may have been barriers to preparation in the past — how the speed of the water released from the basin correlates to water depth near one’s home, for example — are now more concrete.
From the dashboard’s homepage, users can also find answers to Frequently Asked Questions, explore the definitions of flood stages, access historical flood data, and learn more about the science behind the Mendenhall Glacier and Suicide Basin.

Though Fagan now studies in Sweden, he lived in Juneau for the past few summers and experienced the floods firsthand. In 2023 he was on a run through town when the lake brimmed with nearly 15 feet of meltwater and overtopped the river, gushing more than 25,000 cubic feet of water per second through its channel. He heard the emergency response and returned home to learn that some riverfront residences had been swept away.
“That was my first big experience with the Mendenhall Glacier flood events,” Fagan says. Since then, he’s been excited to learn that his own enthusiasm for climate adaptation is matched by many Juneauites. While he returned to the capital this spring to collaborate with researchers on the dashboard, he’s found that some of the most robust meetings have occurred in more casual settings — conversations with his barber and serendipitous discussions with UAS custodians, to name a few.
“I didn’t realize how passionate the community was about the flood,” he says. “Even when I’m not initiating the conversation, it’s the topic of discussion. It causes people anxiety and stress before, during, and after the flood season.”
Most of the 32,000 people living in Juneau count, after all, among the 10 million people globally who are vulnerable to glacial outburst floods. But unlike those of Scandinavia, the Swiss Alps, and the Himalayas, which occur with little warning, Juneau’s flood is an annual event that can be detected roughly one-to-two days ahead of time. Though this window is small, Fagan hopes his dashboard will make a big difference during these key hours. He’s been encouraged by residents’ feedback during community meetings, and inspired by their spirit.
“What people in Juneau have in spades is care for one another,” he says. “When I meet with someone, their number one concern isn’t just their property. They want to search their neighbor’s property, their friend’s property, their family’s, their co-worker’s. They want to make sure that they know who else in the area might be impacted, so that they can help.”
Preparing in Earnest
Several weeks after last August’s flood, when recovery efforts were underway, Penrose-Fischer and other neighbors organized a meeting at the library for community members to share their experiences and concerns. Nearly 80 people showed up. A second meeting brought more than 100 attendees, surpassing everyone’s expectations.
“It was really interesting to be in a room with neighbors who I didn’t know, and hear their stories, which were our shared stories,” Penrose-Fischer says. The gathering grew into Juneau Flood Solutions Advocates, a community organization that has provided perspective to Fagan and is grateful for his dashboard. “We need a better emergency preparedness plan, which includes information and knowledge that the website can provide. This website will help empower us to learn more about the basin and have facts ease the anxiety of the unknown,” she says.
Policymakers have also been getting more involved. Senators Lisa Murkowski and Nick Begich were introduced to the dashboard when they met with Hood this spring to better understand the flood, its cause, and the damage left behind. One of the biggest takeaway messages Hood reiterated during those visits: The outburst event is not going away any time soon.
“In the future, depending on how the basin evolves, the flood could get bigger,” Hood says. “We know that this event will last for several decades, which is why studying it and improving our understanding of its trajectory is critical.”
The dashboard will be ready to use by this summer, though those who brought it into the world are also looking further into the future. Alaska’s glaciers are losing mass faster than any others on earth. Over the coming decades this meltwater is sure to flow somewhere, and several National Science Foundation and National Weather Service projects are planned to study these scenarios.
“In the long run, what we’re doing will be super valuable as a playbook to figure out how to forecast outburst floods effectively in Alaska,” Hood says. “Looking back, what happened in Juneau was pretty predictable, and yet no one predicted it. We should have seen it coming.”
For Penrose-Fischer and other valley homeowners, the dashboard is a critical piece of the puzzle as they continue to advocate for permanent solutions. “If you don’t dream it, it doesn’t happen,” she says. “I have dreams about a ribbon cutting ceremony where there’s a levee that is managing these waters, and that we don’t have to be fretting about a flood every year.”
As Fagan prepares for the dashboard’s summer debut and another semester in Lund, he hopes to build on his education in the Arctic and high mountain terrains. “My dream would be that there’s better communication tools globally for glacial lake outburst floods,” he says. “But Juneau is very unique. I hope the tool offers a wealth of information and is a good jumping-off point for people to feel more comfortable.”